.png)
.svg)
Happiest States
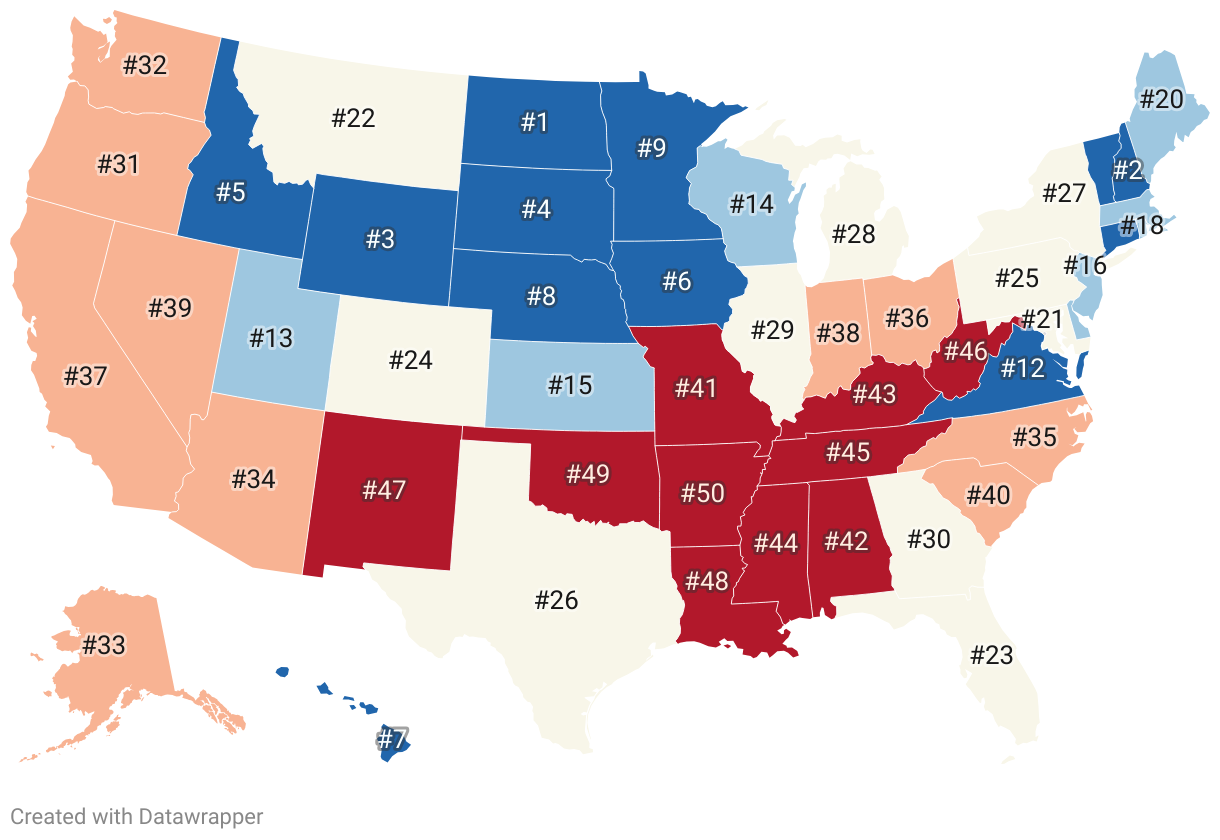


The Pursuit of Happiness: A State-by-State Analysis
How does happiness vary across the 50 states of America? Is living in North Dakota fundamentally happier than living in Arkansas? Our perception of happiness is influenced by various internal and external factors. To understand and measure this elusive emotion, we need to consider an array of factors such as emotional & physical well-being, job security, income growth, work environment, and even the climate.
To delve into this intriguing topic, we created a 'Happiness Score'. This score is a reflection of the state's performance across the three major categories: Emotional & Physical Well-Being, Work Environment, and Community & Environment.
- North Dakota tops the list, dubbed the 'Happiest State', with a score of 73.2.
- In general, states in the northern part of the country, including New Hampshire, Wyoming, and South Dakota, scored highly, indicating a higher level of happiness among their residents when compared to their counterparts in the south.
- Hawaii stands out as an exception to the trend of Northern dominance, securing a seventh position on the list, owing largely to its unique mix of natural beauty and quality of life factors.
- At the other end of the spectrum, Southern states like Arkansas, Oklahoma, and Louisiana scored the lowest, suggesting residents there face more challenges in maintaining optimal emotional & physical well-being, job satisfaction, and a favorable work and community environment.
- There's a large disparity in scores between the happiest state (North Dakota) and the least happy state (Arkansas) – a difference of around 21 points, demonstrating significant regional differences in happiness levels across America.
10 Happiest States
Full Data Set
Frequently Asked Questions
Methodology
Need Help?:
Need the full dataset or have any questions? Our team is happy to help. Contact us at: [email protected]
Need the full dataset or have any questions? Our team is happy to help. Contact us at: [email protected]